
Metrix
Currently, the audience is under-studied in the DMI research community, and the studies that do exist use largely post-hoc data to understand audience perception. Post-hoc data is a useful source of rich quantitative and qualitative data, but this data cannot be reliably tied to any particular temporal moment, and there is considerable evidence that our impressions of happenings in the moment change considerably over time.
For these reasons, I was interested in adding a real-time data dimension to this audience research, as the above evidence suggests that there are new insights to be observed. But, I quickly found that an appropriate tool for this kind of data collection did not already exist. In response, I designed, developed and implemented Metrix for my own research, and it is currently publicly available for use by others.
Why Metrix was necessary
When considering how to do real-time data gathering in a performance setting, I first looked to existing solutions. After reviewing a number of options, I was surprised to find each of them to possess some combination of the following drawbacks: Completely unfit for purpose, drastically over-featured, expensive, cumbersome, inflexible, or lacking in control over the format of the collected data.
At the outset, I had the following requirements for a solution that would allow me to collect the data I needed:
- An interface that was unobtrusive and extremely minimal, as to not interfere with the concert setting.
- Extremely easy to use and learn
- A web-based solution, that would ideally run on a mobile phone but would not require participants having to download and install an app
- A remote control interface that would allow me to make the interface active or inactive as necessary during the concert
- A method of assigning an anonymous username to each participant, so I could associate real-time and post-hoc data sets
- Data that was collected in a way that would be easily accessed processed (ie, JSON format)
- A system that could reliably support up to 65 users connected at one time (this was the capacity of the performance venue)
- Open source, or very affordable
Existing real-time data collection platforms cluster around a number of use cases. Common uses are:
- Marketing purposes, used to gauge user reaction to, for example, online advertising
- Educational purposes, such as providing a means through which instructors can have a real-time sense of student engagement with teaching
- For seminar or conference audiences to respond to a speaker in real time, by providing a means for audiences to, for example, tweet their questions during a presentation, or tweet their comments to the conference screen
None of these use cases applies to this research, and as the above applications are all commercial services, I found that none could be adapted to fit my specific needs.
I was surprised that there was no open source solution that took advantage of ubiquitous mobile technology. For this research, which took place in central London between 2015 and 2017, I could reasonably assume the vast majority of participants would have a mobile phone with them, and the university’s wifi network could support multiple concurrent connections. Further, in the current cultural climate we are all intimately familiar with, and expert at using our own mobile phones, so making a solution for mobile would eliminate the gating factor of an unfamiliar or new device supplied by a third party. This combination of availability, familiarity and existing skill seemed to be an opportunity to place this system on a platform that would be already familiar to the participants.
For these reasons, building Metrix became not only an interesting challenge, but necessary for this research. In addition, since there is an obvious gap for a system to do this kind of audience research reliably and cheaply, it is also an opportunity to develop a research tool that would help not only me, but other researchers in this space. With free and available tools such as Metrix, this kind of audience research could potentially become easier and more cost-effective, and, by extension, has the potential to become more common.
Technical description
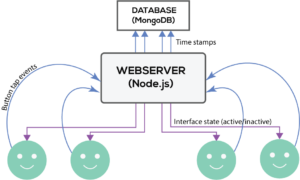
Metrix is a web app built using Node.js that runs on a virtual private server (VPS). Metrix’s interface is designed and implemented using HTML, CSS and JavaScript. Metrix communicates with connected devices using web sockets, implemented using the JavaScript library Socket.io. Button tap data is sent from the participant devices to Metrix through asynchronous HTTP POST requests, and Metrix in turn stores that data in a database built with MongoDB, a non-relational database that stores data in JSON-like documents.
How participants connect
Participants can join the study by navigating to a URL in their phone’s browser. When ready, they enter the study with a button tap.
This button tap assigns their device connection a username that is a combination of two randomly chosen words. Metrix makes an entry in the database with this username, along with the group to which the participant belongs, if applicable. Any time the user taps a button on the active study interface, this button tap is logged in their database entry in the field corresponding to the tapped button.
For the participant, Metrix has two states: Inactive (between performances, when there is no performance taking place and the screen is paused), and active (during the performance, when the buttons are available to tap). During the active phase, participants are able to tap buttons. During the inactive phase, the performance is over and participants are given time to fill out their short post-performance surveys, and therefore no button tap data is useful.
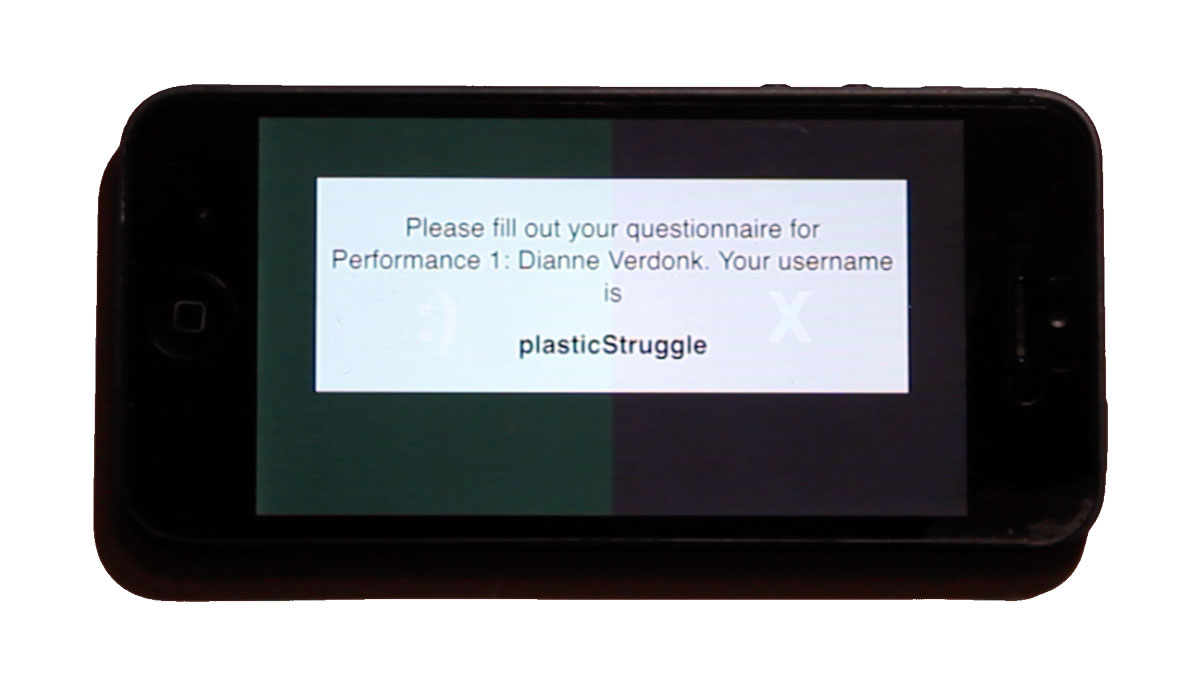
During this inactive phase, the screen reminds the participant of their username. The username is key in this process, as it allows the participant’s post-hoc and real-time data to be associated at the time of data analysis. Therefore, the username is always kept at the forefront, in case it changes (this can happen if the participant closes their browser and opens it up again), or they have not yet noted it on their survey book.
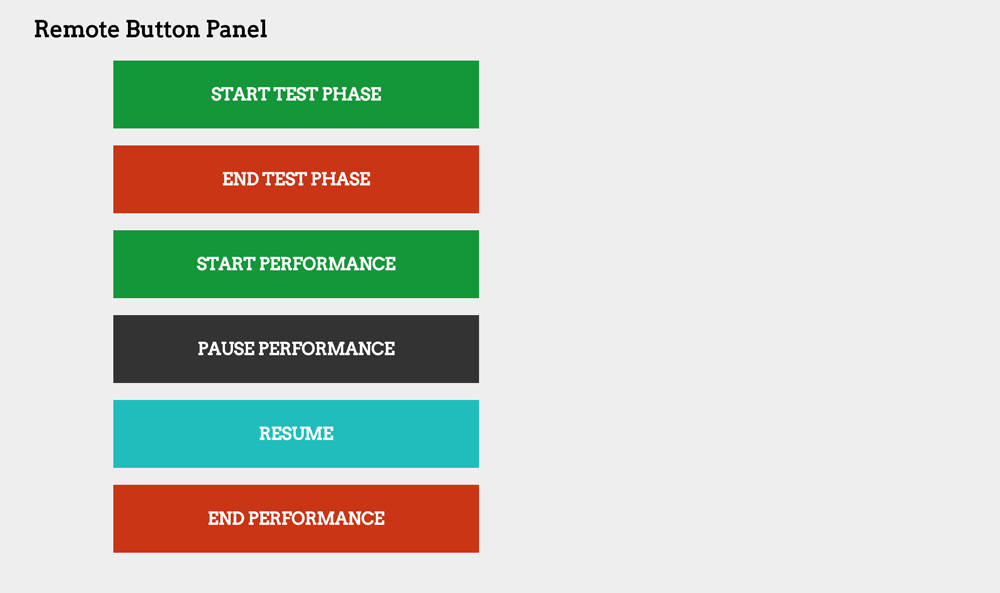
Metrix moves between these states via a remote control interface, operated by the study investigator. Here, the investigator can make the interfaces of all connected phones active or inactive by tapping a button. These button taps are also logged in the database under a user named `remote’, so there is record of when the performances were started and stopped.
Metrix collects data in time stamps. When any button is pressed, either by a participant or on the remote control, a message is sent to Metrix from the participant’s device with the time stamp of the tap, the button that was tapped, and the participant’s username. In turn, Metrix updates that user’s file in the MongoDB database with the time stamp data in the field corresponding to the tapped button (if the button’s field does not yet exist, it is automatically created).
The logging of remote control buttons is crucial, as it allows the participant time series data to be synchronised with the video footage of the performance, allowing for later evaluation.
The recorded performance footage also needs a point of syncronisation with this button tap data. This was achieved with the use of a dog clicker, a device used in dog training that produces a loud and distinctive click. At the same moment of pressing the button on the remote control panel to activate the interface, I also pressed the dog clicker, producing an audible and distinctive click on the audio recordings of the video footage. This creates a point of reference where the video and time-series data could be synchronised later.
Interface
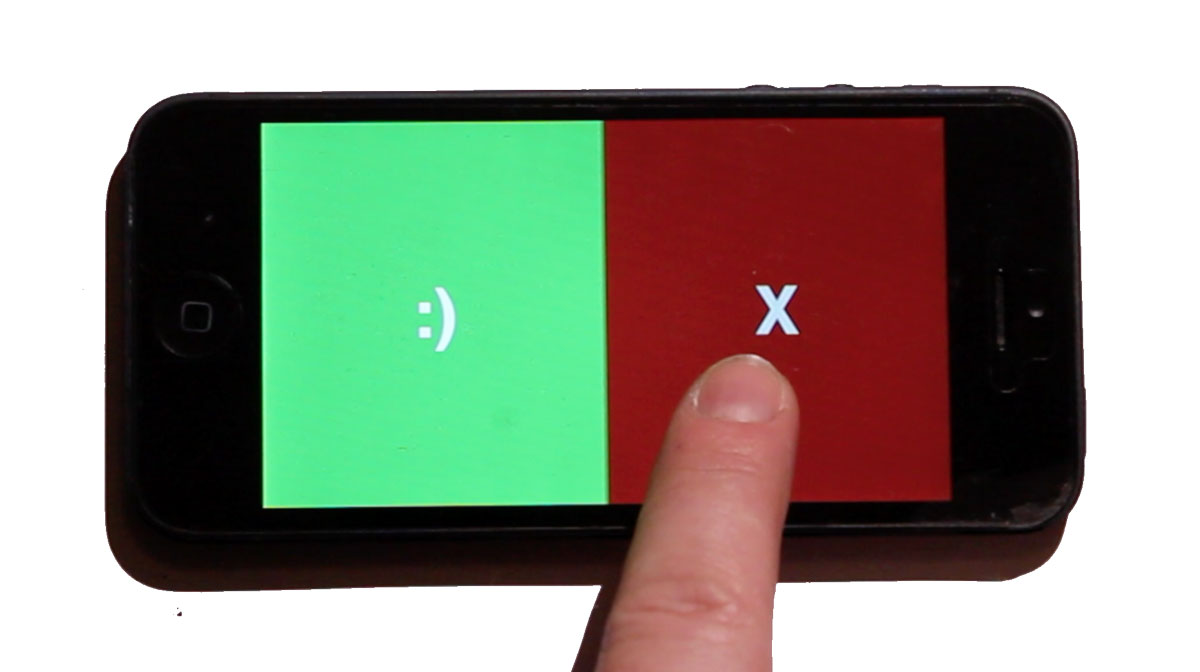
The active Metrix interface is composed of a screen split in half into two buttons, for discrete indications of ‘enjoyment’ and ‘error’. The buttons are logged independently, and can be pressed together if desired.
Audiences were free to press these buttons as often as they saw fit: They were free to press them frequently, occasionally, or not at all, and to decide when the performance warranted their indication. As the buttons could both be pressed at once, the `enjoyment’ and `error’ states were also independent in function. Additionally, the use of the entire side of a phone screen means that audiences can use two thumbs to tap the buttons, and don’t require looking for and finding specific active areas of the screen. Using both sides of the screen does not rely on any button-pressing accuracy, does not require the participant to remember multiple button functions, or and also does not require them to monitor and think about multiple internal emotional states.

Value points
Though an in-depth evaluation of Metrix’s effectiveness in an audience setting is beyond the scope of this research, it has proved a valuable tool in this investigation process. This section summarises the features that added value, indicators of success, and evidence that participants found it easy to use, and used it. Additionally, this section details points to be improved in future iterations.
1. Flexibility
Because it is built using web technologies, Metrix’s design and function are very flexible. Experimenting with the interface, changing the design, and changing the way data is sent to the database in order to meet the needs of this specific research context — something that would be impossible, or at least very difficult with a commercial application — has been possible. Additionally, because the only cost has been my development time, I have not been under pressure to use outside services sparingly, and have therefore had the opportunity to test this system and respond to participant feedback in order to test design assumptions.
Additionally, the flexibility of this system means that it could potentially have multiple uses. I have implemented an aspect of Metrix that allows for the same real-time evaluation of video footage using the YouTube API, and then collect post-hoc responses through an online form. Though the research described in this thesis is specifically and consciously done within a live context, the potential exists for Metrix to be useful in a variety of research applications.
2. Cost effectiveness
Commercial systems to gather this kind of data are often expensive, or administered by costly consultants. Metrix, however, is open source and built with free and open-source technologies (\corrections{though it does require a VPS to run because of the Node.js processes, but these are typically widely available and inexpensive}).
3. Stability
The technology used for Metrix — Node.js, HTML/CSS/JS, Sockets.io and MongoDB — easily handled 60+ concurrent connections. No load testing has been done for large audiences, but a system built using these technologies can be expected to handle concurrent connections numbering in the thousands. Therefore, Metrix is at low risk of crashing or encountering problems with a musical audience on the scale of that which is typically studied in DMI research.